


An employee stock plan comes with multiple reports. Reporting is a time-consuming process and static reports are quickly out-of-date and are easily ignored.
Luckily, with Global Shares’ advanced Business Intelligence (BI) Reporting tool, it’s never been easier to compile real-time and meaningful reports without stressing over spreadsheets.
Now, your team can rely on a single source of up-to-date truth to analyze the same set of data and access the freshest insights for your employee stock plan. Reporting can be delivered on-demand or scheduled, to be automatically generated and ready for retrieval.
Customized dashboards
Our BI tool offers simple-to-understand and highly customizable dashboards. Each dashboard comprises multiple widgets (e.g. graph, map, chart and counter). A standard dashboard comprises three parts:
- Counter or Indicator widgets across the top of the dashboard (e.g. no.of total participants, no. of active participants)
- Graphical widgets below the Counter/Indicator widgets (e.g. bar chart, geographical maps – particularly useful when managing a global stock plan)
- A detailed report in a table form will appear when scrolling further down the dashboard. Readily available to export.
You can also customize your dashboard layout with drag-and-drop features to place each widget exactly where you want. Each widget can be downloaded as an image or a CSV file.
Our widgets ensure you get the exact report you need. Simple-to-understand tools create simple-to-understand visuals – saving time and ensuring that you can make the most out of your data.
A wide variety of data at your fingertips
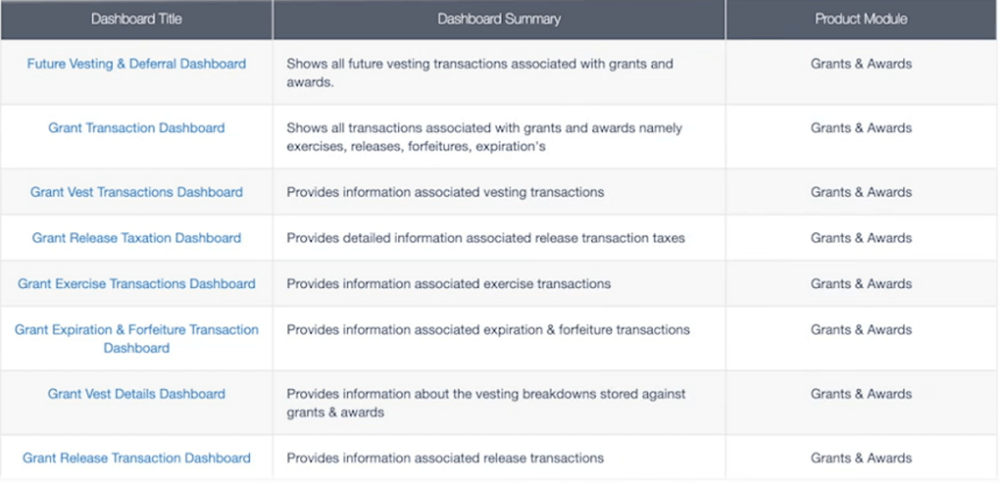
We offer a wide variety of dashboards – from standard dashboards that everyone has access to, to client-specific and even user-specific dashboards. Here’re just some of the examples: Participant & Trust Overview, Cash Payments, Grant Balance, Future Vesting & Deferral, Participant Tax & Payroll etc.
Once you have landed on your desired dashboard, you’ll be able to filter data by
- Toggling some of the data on/off; or
- Selecting single/multiple elements on a graph (e.g. bar(s) of a bar chart)
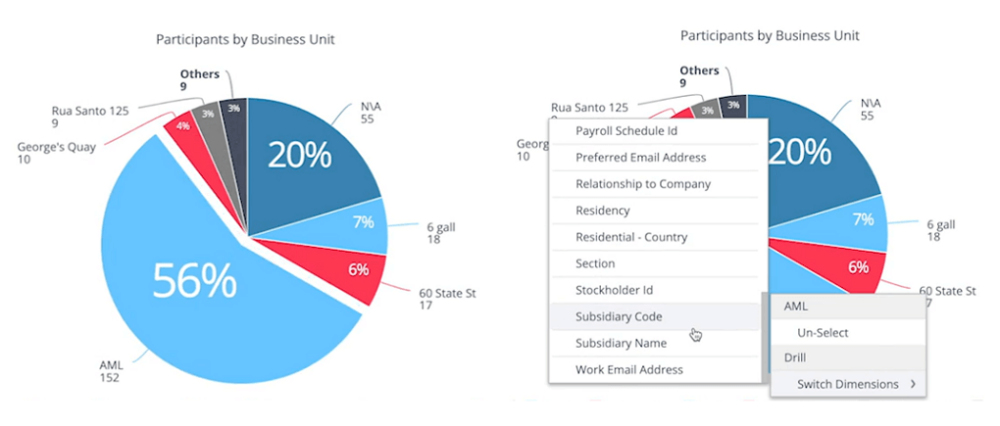
Our smart tool also enables you to quickly drill down into granular data (e.g. gender, job title, department, residency and subsidiary) by right-clicking on an element that you’re interested in within a widget (e.g. a chart or a graph). In the example below, you’re interested in the element ‘’AML’’. Right-click on that to drill down into any dimensions that you are interested in.
Dynamic reporting
Our dynamic reports are real-time and interactive.
Our BI reports allow you to see what’s happening right now, rather than having to wait until the end of the month to get a snapshot of your stock plan situation. They also enable you to interact with data through interactive functionalities to flexibly conduct data analysis.
When managing an employee stock plan, there are multiple dimensions of data to be analyzed and data changes by the minute. Without the right reporting tool, it’s hard to generate data to obtain insights and make adjustments.
That’s why we built our BI tool to be dynamic. With our online reporting facility, you can easily create, analyze and reshape reports in real-time. Just one click and you have an updated report. Imagine you’re presenting to the Board, and five minutes before you’re about to go on, you realize you forgot an important field, or they ask to see something new. With a static report, you’re out of luck. But with our BI tool, you have four and a half minutes extra.
Built for everyone
Like everything we build, our BI tool is designed for both advanced and novice users. As our Product team always says: it’s comprehensive but clear. The BI tool empowers even the most non-technical user to visualize instantly:
- Geographical maps – participants/awards by location
- Performance indicator measurements
- Equity trends
- Fair value correlations
- Expense accrual comparisons
Users can either look at the larger picture, or drill down into the details, or combine multiple views for both.
How does Global Shares BI reporting help to achieve a successful stock plan?
- Customizable dashboards with intuitive widgets
We have a wide range of dashboards available. Simply click on the dashboard you’re interested in – all requested stock plan data is at your fingertips for analyzing and making an informed decision.
Our tool allows for the generation of various types of widgets – tables, charts, maps and etc. These intuitive widgets uncover stock plan insights visually in an easy-to-digest way. They can also be exported as a CSV file for data analysis or an image for presentation. - Drills down into granular data with ease
For each widget you build, you can drill down into granular details with one click or two. With this powerful feature, you can understand multiple dimensions of every single component, including participation rate by gender, job title, subsidiary and office status.
If you identify, for example, junior staff has a low participation rate, you can review your communication strategy particularly for this group. - Dynamic reporting – real-time and interactive
Real-time and interactive data allow you to see what’s happening right now in different dimensions, meaning you can change your query to view an updated report with one click.
It helps you make accurate and quick adjustments to your plan, unlike static reports that have zero flexibility and can become out-of-date quickly. - A single source of up-to-date truth
Our BI reporting tool ensures all users look at the same dataset to avoid unnecessary confusion when discussing and analyzing stock plan data. It makes stock plan management more efficient. - Reporting can be delivered on-demand or scheduled
Since the reports can be automatically generated, your team can save much preparation time. So, more effort can be spent on analyzing plan data to optimize your employee ownership plan
Traditional BI reports vs Global Shares’ BI reports
Traditional BI Reporting | Global Shares’ BI Reporting |
|---|---|
Static | Dynamic |
Time-consuming | Time-saving |
High risk of human errors | Low risk of human errors |
Managed on a spreadsheet | Managed with an advanced BI reporting tool |
Data and formulas need to be manually input | Whatever data could be pulled and filtered faster |
Data is fixed. Users need to re-input a new data set to see different dimensions | Data is interactive – can be easily drilled into further details and updated to different dimensions with a few clicks |
Causes the danger of multiple versions of the report circulating among colleagues | Provides single source of truth |
Static reports can become out-of-date quickly | Real-time reports |
Advanced BI Reporting: it’s just another way we’re making employee ownership simpler. To read more about share plans and how we can work with you, please click here.
Contact us for a free demo today.