


BI REPORTING
Data at your fingertips
Empower even the most non-technical user with the ability to access data and build interactive tools and business intelligence reports. Global Shares’ BI tool provides a variety of widgets to pinpoint the best visualisation for your data.

Trusted By Businesses Worldwide
Features

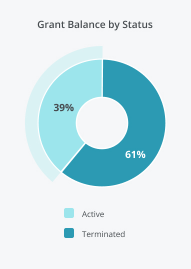
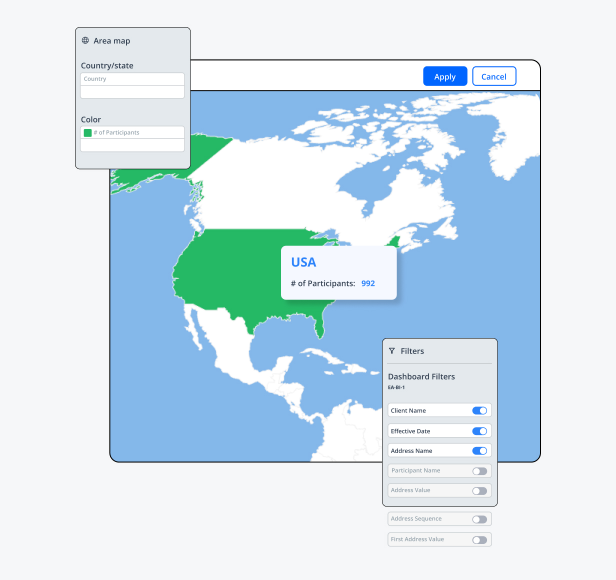
Geographical maps
See participants and grants by location
Global and regional maps illustrate how the number of your participants breakdown geographically. At a glance, quickly learn:
- Which countries and states are subject to different taxation laws
- Where translations may be needed
- Where caution is required regarding different or enhanced privacy laws and regulatory topics

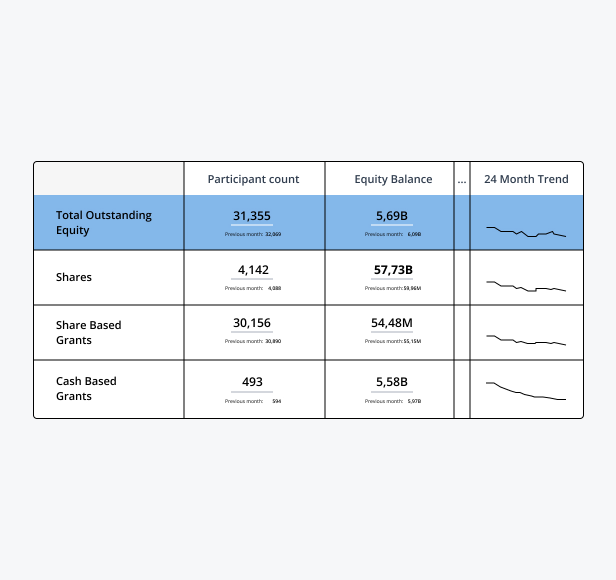
KPI Scorecards
Gauges to measure key performance indicators (KPIs)
- Quickly reference and compare values between key areas and understand how they performed in the previous month and over a 24-month period.
- Learn meaningful grant metrics such as the total number of grants (issued versus outstanding) and use values that are aligned with security and reporting currencies.

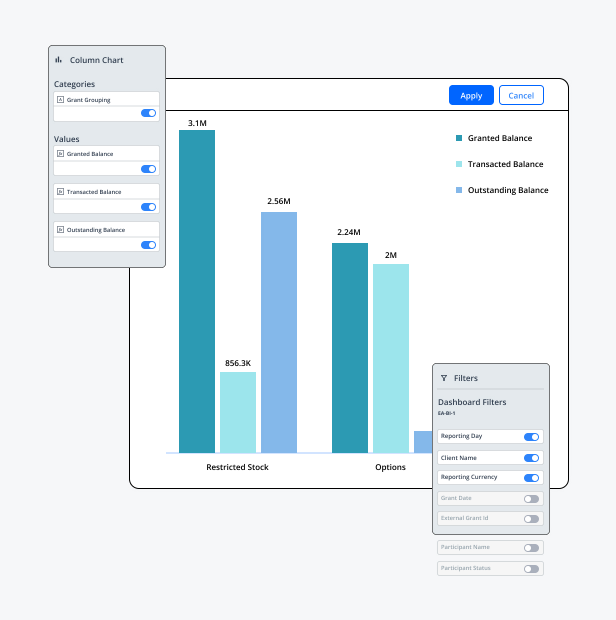
Charts & Graphs
Visuals that help determine equity trends
- Our charts offer switchable dimension functionality which lets users drill down into granular data sets and understand how different grant types, plans, and securities breakdown throughout the company.
- Track metrics that change over time and identify trends in the market. The framework transforms data into an easy-to-understand format which enables data-driven decision-making and improves overall performance.

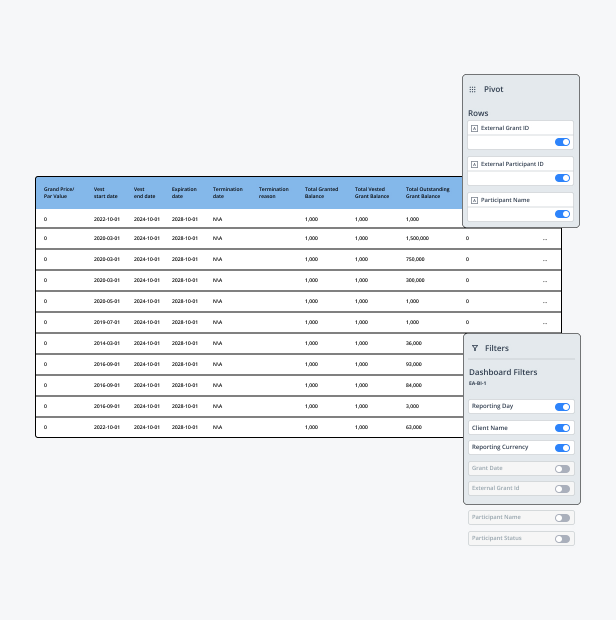
Report & Pivot Tables
Detailed reports to examine large datasets
Pivot tables provide a consolidated view of key data points such as grants at a tranche level or total grants transacted per different stock plan or security, allowing for easy analysis and comparison. Swap out fields, values, and filters to create a table that fits your reporting needs.

Fully Customisable
Customise your dashboard layout with drag-and-drop features to place each widget exactly where you want. You can easily click to create reports on a variety of topics, nailing down the exact information you need.

Intuitive Insights
Uncover participant insights using data-rich graphics. Present key statistics in an easy to digest way using intuitive visualisation tools. Use drag-and-drop features for quick analysis or set a global filter to instantly adjust information at the click of a button.

Highly dynamic
With dynamic visuals, you can change a query simply by selecting a section of the graph or chart. For each visual built, you can avail of the drill down capabilities to analyse metrics at a granular detail or combine multiple views to understand the bigger picture.
Product FAQs
Yes, our BI Dashboards offer customisation options to suit individual or departmental needs. You can choose which KPIs/Dimensions to display, how data is visualised, and even set up custom filters. The level of customisation will vary depending on an individual’s role and permissions within the organisation.
The frequency at which data is refreshed depends on the data sets of that dashboard and the specific dashboard setup. Some dashboards update in real-time, while others may do so at scheduled intervals, such as hourly or daily.
Yes. Our dashboards allow users to export data into formats such as Excel, PDF, or CSV for further analysis or reporting purposes. The availability of this feature and the formats supported may vary depending on the dashboard, chart, or report being used.
Additional metrics can be added, but it will depend on where the data is pulled from. Should a client require additional metrics, the reporting team can evaluate the feasibility of integrating new data sources and customising the dashboard to meet their needs.
Data accuracy in BI Dashboards is ensured through data validation rules, data cleansing processes, and the implementation of ETL (Extract, Transform, Load) pipelines that prepare data for analysis. Consistency is maintained by using data model techniques that aggregate data from multiple sources into a single, coherent model, and by employing data governance practices.
Read More
-

What is Equity Plan Administration?
July 16, 2024
-

Stock Vesting: Schedule, How it works, Examples
July 9, 2024
-

How Fred transformed his private company with an LTIP
March 12, 2024