Running an employee equity compensation plan brings with it unavoidable admin and requirement for multiple reports. Reporting, while essential, is a time-consuming process and static reports are quickly out-of-date and easily ignored.
Having up-to-date, accurate data available at your fingertips via BI reporting can empower even the most non-technical user to analyze datasets and access the freshest insights for your employee equity compensation plan. Reporting can be delivered on-demand or scheduled, to be automatically generated and ready for retrieval.
Customized dashboards
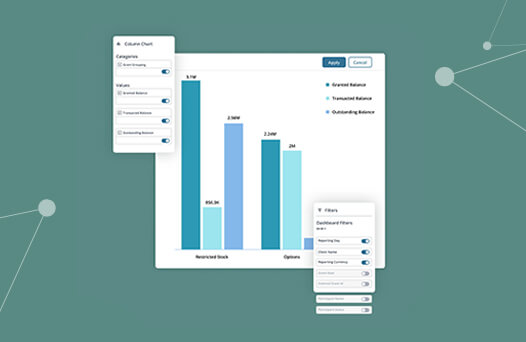
J.P. Morgan Workplace’s BI tool offers simple-to-understand and highly customizable dashboards that help you analyze and visualize complex data. Each dashboard comprises multiple widgets (e.g. graph, map, chart, and counter). A standard dashboard comprises three parts.
- KPI scorecards across the top show at a glance the number of total participants, number of active participants, etc.
- Graphical widgets illustrate the information as bar charts or geographical maps – particularly useful when managing a global stock plan)
- A detailed report in table form will appear when scrolling further down the dashboard. Readily available to export.
You can also customize your dashboard layout with drag-and-drop features to place each widget exactly where you want. Each widget can be downloaded as an image or a CSV file.
Our widgets help you get the report you need, displaying the information you require.
Simple-to-understand tools creating simple-to-understand visuals save time and help you make the most out of your data, e.g., filtering participants and grants by location, using meaningful grant metrics to measure key performance indicators, and determining equity trends.
Enhanced analytics for all your reporting needs
Once you have landed on your desired dashboard, you’ll be able to filter data by
- Toggling some of the data on/off; or
- Selecting single/multiple elements on a graph (e.g., bar(s) of a bar chart)
Our smart tool also enables you to quickly drill down into granular data (e.g., gender, job title, department, residency, and subsidiary) by right-clicking on an element that you’re interested in within a widget (e.g., a chart or a graph). If you’re interested in the element ‘AML’, simply right-click on that to drill down into any relevant dimensions.
Dynamic reporting
Our highly dynamic reports are near real-time and interactive meaning you get BI reports that allow you to see what’s happening almost as it happens, rather than having to wait until the end of the month to get a snapshot of your stock plan situation. They also enable you to engage with data through interactive functionalities to flexibly conduct data analysis.
When managing an employee stock plan, there are multiple dimensions of data to be analyzed and data changes by the minute. Without the right reporting tool, it’s hard to generate data to obtain insights and make adjustments.
That’s why we built our BI tool to be dynamic. With our online reporting facility, you can easily create, analyze, and reshape reports in near real-time. Just one click and you have an updated report. Imagine you’re presenting to the Board, and five minutes before you’re about to go on, you realize you forgot an important field, or they ask to see something new. With a static report, you’re out of luck. But with our BI tool, you have four and a half minutes extra.
Built for everyone
Like everything we build, our BI tool is designed for both advanced and novice users. It’s comprehensive but clear. The BI tool empowers even the most non-technical user to visualize instantly:
- Geographical maps – participants/awards by location
- Performance indicator measurements
- Equity trends
Users can either look at the larger picture, drill down into the details, or combine multiple views for both.
How does JP Morgan Workplace Solutions’ BI reporting help to achieve a successful stock plan?
1. Customizable dashboards with intuitive widgets
We have a wide range of dashboards available. Simply click on the dashboard you’re interested in – all requested stock plan data is at your fingertips for analyzing and to help you make an informed decision.
Our tool allows for the generation of various types of widgets – tables, charts, maps etc. These intuitive widgets uncover stock plan insights visually in an easy-to-digest way. They can also be exported as a CSV, Excel, or PDF file, and also as an image.
2. Drills down into granular data with ease
For each widget you build, you can drill down into granular details with just one or two clicks. With this powerful feature, you can examine multiple dimensions of every single component, including participation rate by gender, job title, subsidiary and office status.
If you identify, for example, junior staff have a low participation rate, you could put this information to use by reviewing your communication strategy particularly for this group.
3. Dynamic reporting – near real-time and interactive
Near real-time and interactive data allow you to see what’s happening with your stock plan in different dimensions, meaning you can change your query to view an updated report with one click.
It can help you to make accurate and quick adjustments to your plan, unlike static reports that have zero flexibility and can become out-of-date quickly.
4. A single source of truth
Our BI reporting tool ensures all users look at the same dataset, thereby avoiding unnecessary confusion when discussing and analyzing stock plan data. It makes equity management more efficient.
5. Reporting can be delivered on-demand or scheduled
Since the reports can be automatically generated, your team can save much preparation time. So, more effort can be spent on analyzing plan data to optimize your employee ownership plan.
Find out more:
Luckily, with JP Morgan Workplace Solutions’ advanced Business Intelligence (BI) Reporting tool, it
has never been easier to compile near real-time and meaningful reports without stressing over spreadsheets.
Advanced BI Reporting, it’s just another way we’re making employee ownership simpler will help you simplify equity compensation management.
At J.P. Morgan Workplace Solutions we work with companies from around the world every day to help bring their reward strategies to life. Our tech and service-based offering was created to empower employees to easily navigate their workplace incentives with confidence.
Contact us for a free demo today and find out how you too can begin reaping the benefits of equity compensation.
Employee ownership, simplified – it’s what we do.
This publication contains general information only and J.P. Morgan Workplace Solutions is not, through this article, issuing any advice, be it legal, financial, tax-related, business-related, professional or other. J.P. Morgan Workplace Solutions’ Insights is not a substitute for professional advice and should not be used as such. J.P. Morgan Workplace Solutions does not assume any liability for reliance on the information provided herein.